Outdated guides, missing feature coverage, and text-heavy content accumulate quietly, UNTIL they start costing you users.

Nibu Thomas

Every engineering team knows about technical debt. The quick fix that became permanent. The workaround that outlived its usefulness and then continues to live on because of an architecture decision that nobody wants to revisit.
Documentation debt works exactly the same way, except that it's almost never tracked or rarely ever discussed in sprint planning. Yet, its consequences show up somewhere nobody is looking - in your product adoption curve!
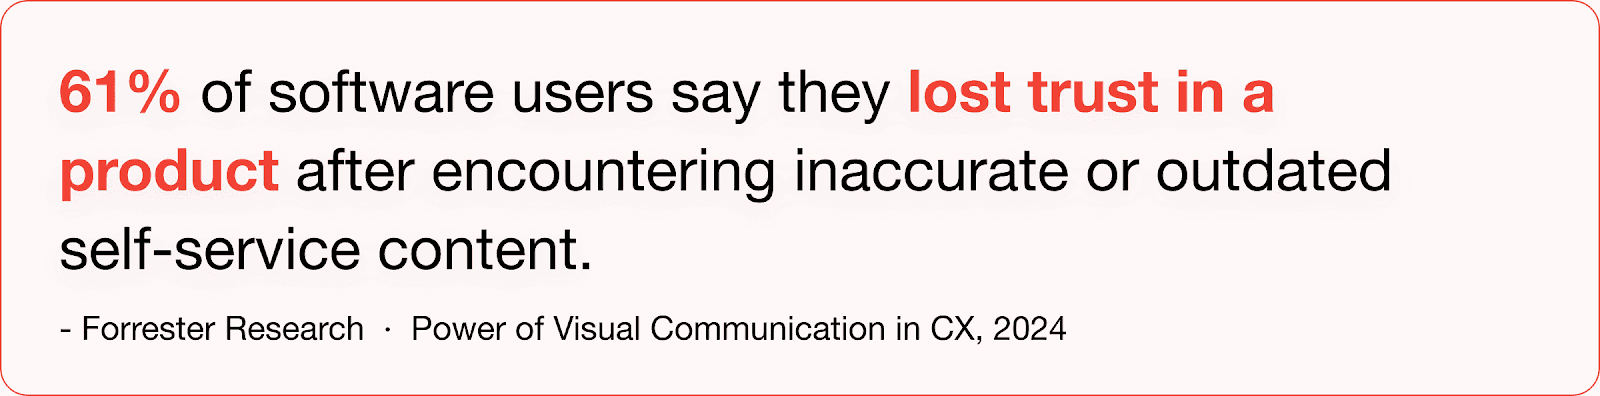
A help article written for a UI that no longer exists. A setup guide with 14 text steps and zero visuals. A features page that doesn't mention the three capabilities you shipped last quarter. Individually, each is a minor problem. Collectively, they are quietly killing your users' confidence in your product.
What Documentation Debt Actually Looks Like
The term 'documentation debt' covers a wide range of neglect, but three categories cause the most damage to product adoption:
1. Missing Feature Coverage
This is the most expensive form of documentation debt, and the hardest to see. When a feature ships without accompanying documentation or when a major update makes existing docs obsolete, users are left to figure things out alone. And that’s not a nice place to be.
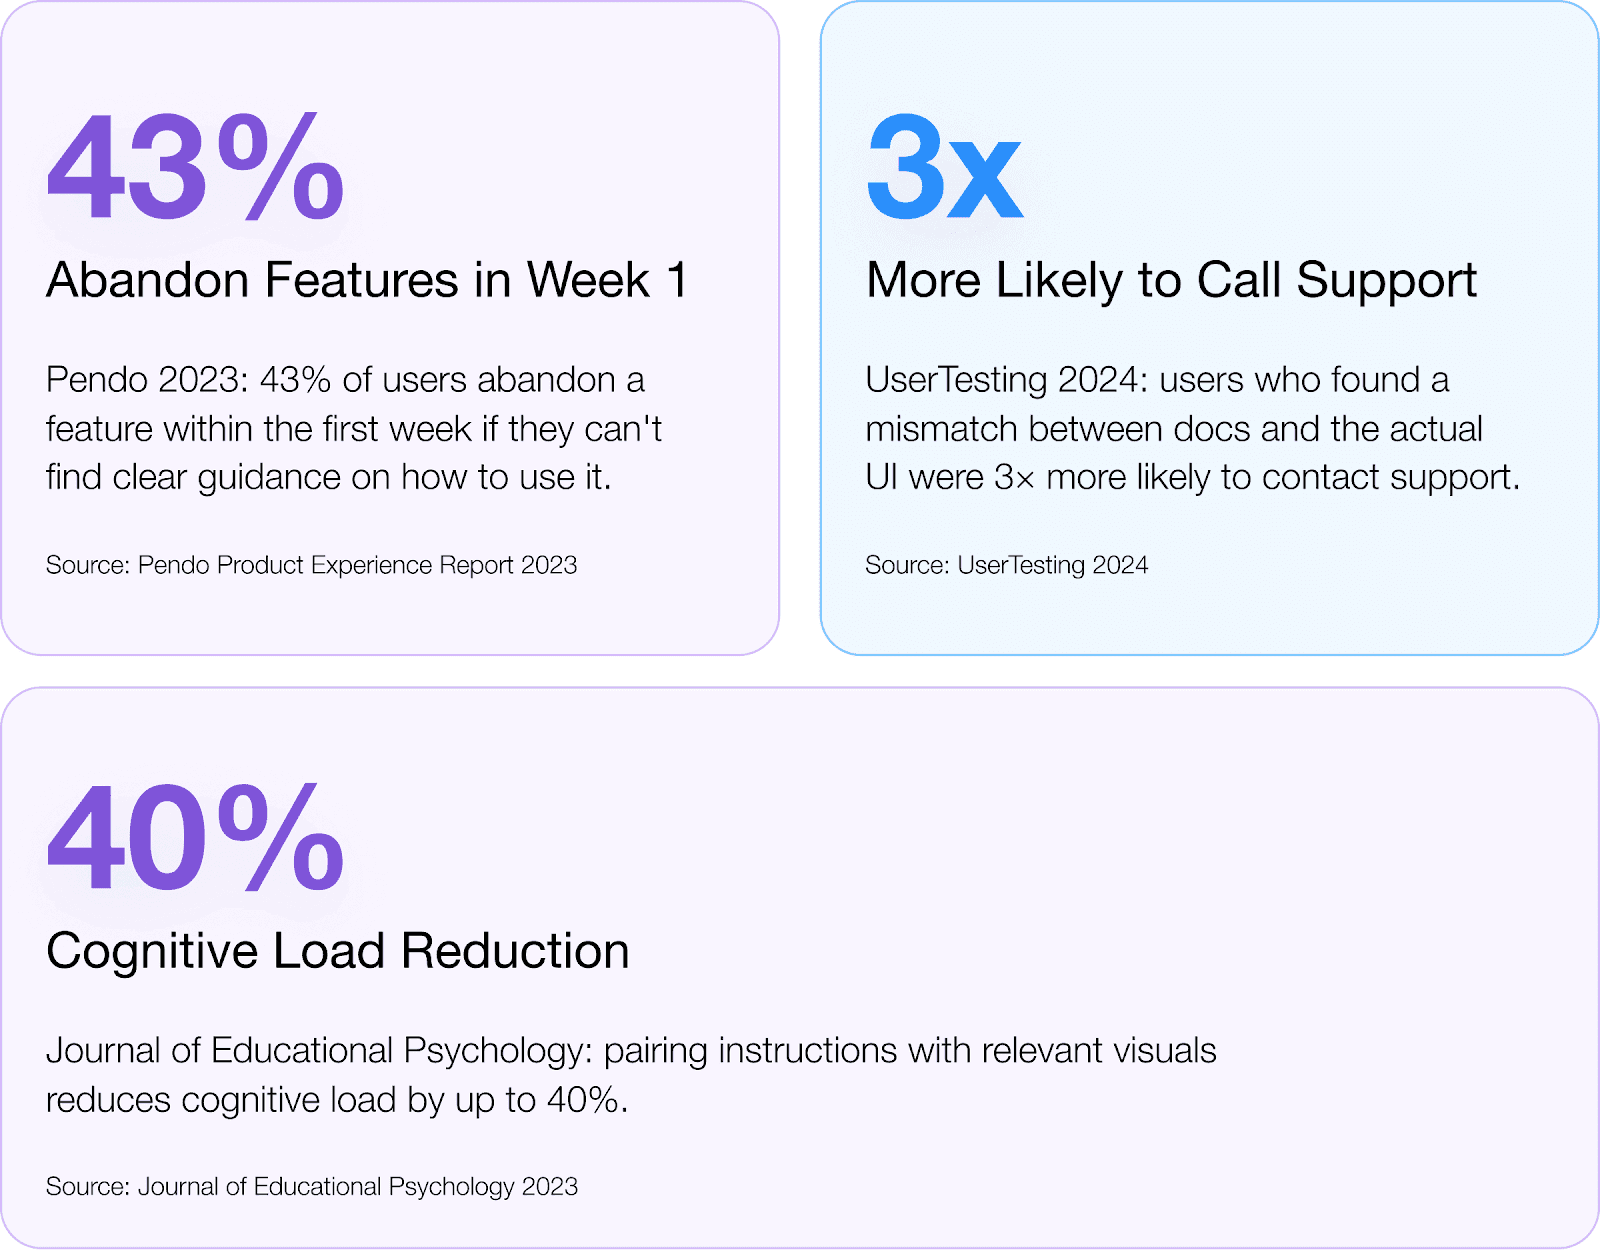
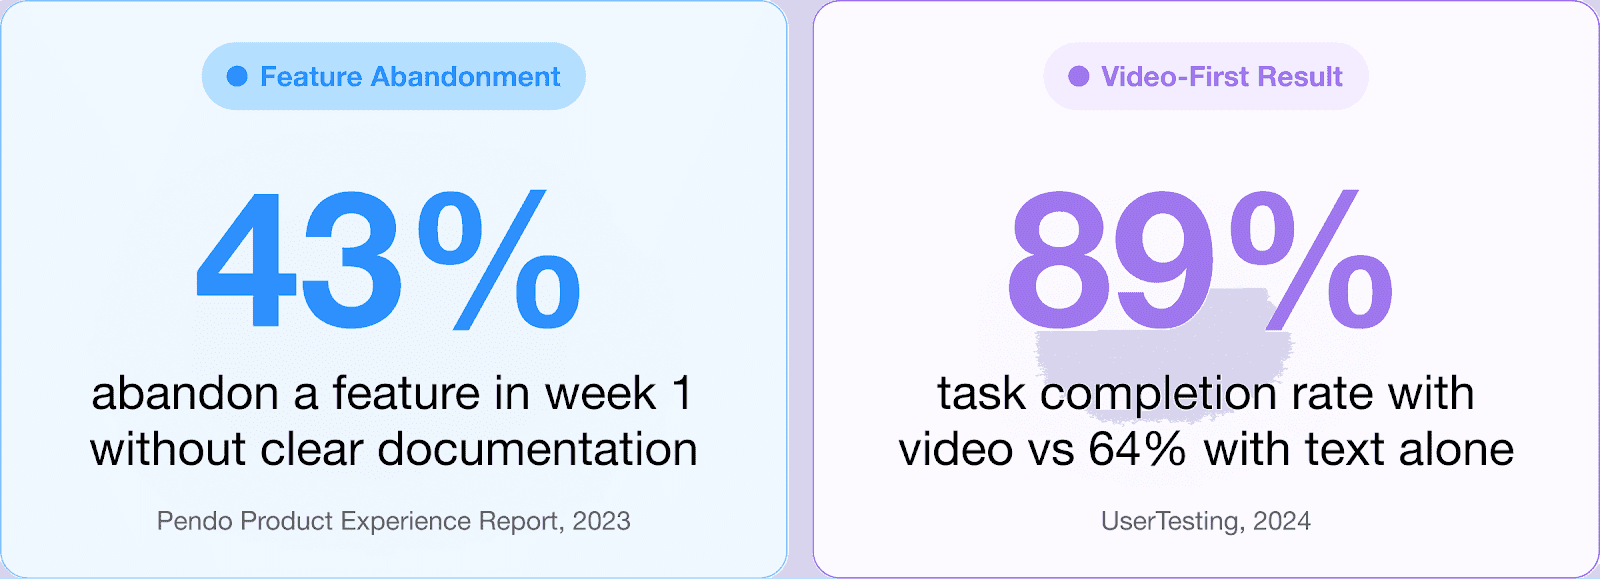
The consequences are predictable. A 2023 Pendo report found that 43% of users abandon a feature within the first week if they can't find clear guidance on how to use it. There are no second chances! They don't assume the feature is broken. Users assume they themselves are broken. And a confused user doesn't churn noisily. They quietly disengage.
Missing coverage also has a compounding effect. Features that never get documented tend to stay undocumented. The longer the gap, the more daunting it feels to close. Teams deprioritise it and soon, the debt accumulates interest.
2. Outdated Screenshots and UI Changes
Every product redesign, UI refresh, or navigation change creates a wave of documentation debt. Screenshots show buttons that have moved. Walkthroughs reference menus that no longer exist. Step three says 'click the gear icon in the top right', but the gear icon is now a person icon, and it's top left! Of course many writers don’t include screenshots for this reason. It’s easier to simply update text. But they are only looking at things from a content creation perspective. Discussed in detail below.
"A 2024 UserTesting study found that users who encountered a discrepancy between documentation visuals and the actual product interface were 3X more likely to contact support than users whose documentation matched their experience."
This support cost is real. But the trust cost is worse. When documentation doesn't match reality, users don't assume the docs are outdated. They assume something is wrong with their account, or their setup, even their understanding! Confidence erodes, and with it, adoption.
This type of debt is also uniquely resistant to manual fixes. Hunting down every screenshot after a redesign is time-consuming, tedious, and rarely prioritised. Which is why it tends to linger long after the product has moved on.
3. Text-Heavy Guides with No Visuals
The third type of documentation debt is more subtle, and perhaps more insidious, because it was never 'wrong.' It was just created at a time when text was the only realistic option.
Research from the Journal of Educational Psychology consistently shows that users learning technical tasks from text alone must mentally translate written instructions into visualised actions and this is a cognitively expensive process that increases error rates and reduces completion! The same research suggests that pairing instructions with relevant visuals reduces cognitive load by up to 40%. Let that number settle in.
Put simply: a guide that tells users what to do, without showing them, is objectively harder to follow than one that does both. Would you agree? In a world where 83% of users say they prefer video over text for learning software (TechSmith, 2024), text-only documentation is not just a missed opportunity. It is a fast accumulating liability.
Before you can pay down documentation debt, you need to know how much you owe. And one of the ways to fix this is to measure the gap and prioritize what’s important. That’s the only way to get more done with less. And that’s where a scoring framework can help.
The Documentation Debt Audit: A Scoring Framework
The following framework gives documentation teams a structured way to audit their existing content, prioritise fixes, and build a debt-reduction roadmap.
Score each article or documentation section across the five categories below. A score of 3 indicates critical debt; 1 indicates minor. Any piece scoring 10 or above across all categories should be treated as high priority.
Debt Category | Score (1–3) | Priority Action |
Missing feature coverage | 3 = Critical gap / 1 = Minor | Create new content immediately |
Outdated screenshots / UI | 3 = Wrong UI shown / 1 = Minor cosmetic | Re-record or update visuals |
Text-heavy, no visuals | 3 = Pure text walls / 1 = Some visuals | Convert to video or add annotated screencaps |
Broken or stale links | 3 = Core flow broken / 1 = Edge case | Fix or redirect, audit monthly |
Low engagement / high bounce | 3 = <40% completion / 1 = 60%+ | Reformat or consolidate content |
Run this audit across your top 20 most-visited help articles first. These are the pages with the most exposure and, therefore, the most compounding impact on user trust and adoption. If your analytics show high bounce rates or short time-on-page for any of them, treat those as automatic 3s in the engagement category.
Prioritising What to Fix First
Not all documentation debt is equal, and for sure, not all of it needs to be fixed by rewriting. The goal is to triage effectively:
Missing feature coverage should be addressed immediately for any feature that is part of a user's core workflow or mentioned in sales conversations.
Outdated screenshots are best resolved at the source by changing how documentation is produced. Manually replacing images after every UI update is not practical.
Text-heavy guides are strong candidates for format conversion. A 12-step text walkthrough is often better replaced than rewritten.
Paying down documentation debt is not primarily a writing problem. It is a production problem. The reason debt accumulates is that keeping documentation current is slow, manual, and perpetually deprioritised against shipping new features.
The Real Fix: Make Staying Current Easier Than Falling Behind
Here is the uncomfortable truth about documentation debt: auditing it and prioritising it will only get you so far. If the underlying production process remains slow and friction-heavy, debt will continue to accumulate faster than you can pay it down.
The teams that escape the documentation debt cycle are not the ones with the most disciplined writers. They are the ones who have changed the economics of content creation itself.
The shift looks like this: instead of treating documentation as a writing task, treat it as a recording task. When a product manager demos a new feature, that demo is the documentation. When a customer success manager walks a user through a workflow, that walkthrough is the documentation.
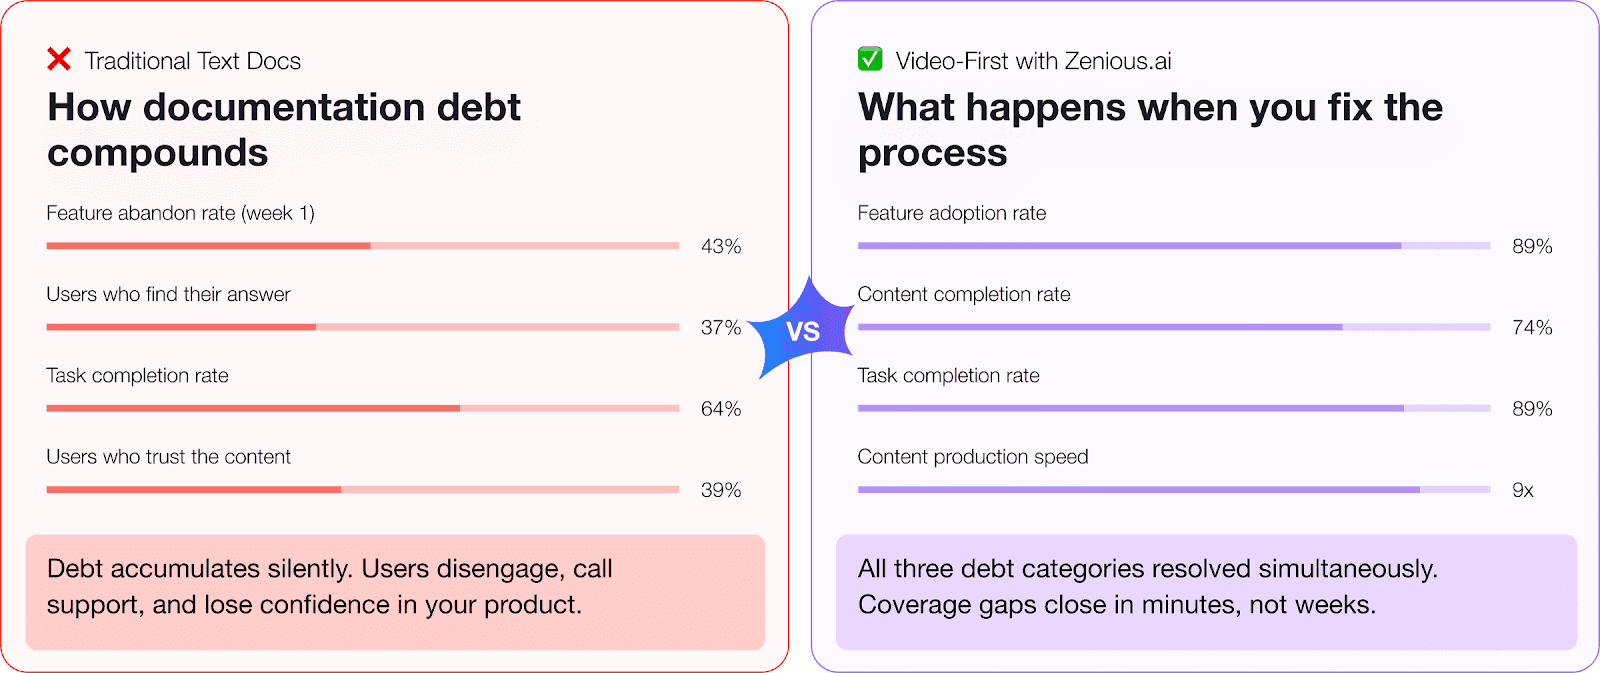
Video-first documentation solves all three debt categories simultaneously. Feature coverage gaps close because recording a demo takes minutes, not hours. Outdated screenshots become irrelevant because the video shows the live interface. Text-heavy guides become engaging walkthroughs that users actually complete.
"When creating good video takes less time than writing a doc, documentation debt stops accumulating by default. The incentive structure changes entirely."
A 2024 UserTesting study found that task completion rates jump from 64% with text-based documentation to 89% with video! That 25-percentage-point gap represents real users, successfully adopting your product.
The teams that close that gap are not working harder. They have changed the medium, and in doing so, they have changed what it costs to stay current.
Documentation debt is not inevitable. It is the predictable result of a production process that makes keeping content fresh harder than letting it decay.
Change the process, and the debt stops accumulating.
Sources
Pendo. (2023). Product Experience Report: How Users Learn Software.
TechSmith. (2024). Video Viewer Habits Study.
UserTesting. (2024). The ROI of Video in Product Documentation.
Forrester Research. (2024). The Power of Visual Communication in Customer Experience.
Mayer, R. E., & Moreno, R. (2023). Cognitive Load Theory and Multimedia Learning. Journal of Educational Psychology, 115(4).


